Request Demo

Gridics Adds City of Miami Beach, Bal Harbour Village to Platform

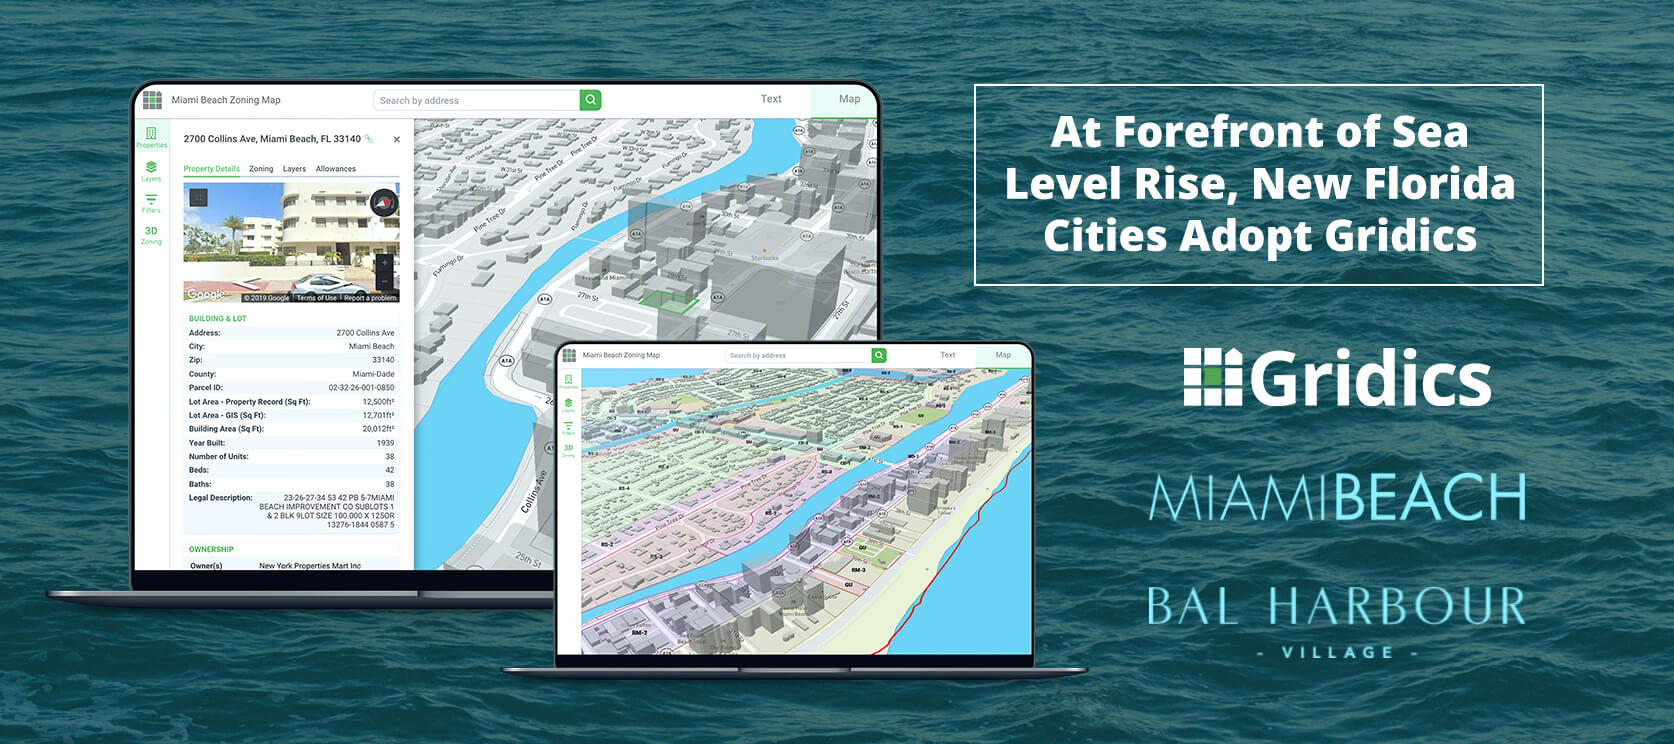
Florida cities on front lines of sea level rise adopt Gridics platform to help visualize zoning changes.

For Immediate Release:  September 25, 2019

Miami, FL – Gridics LLC, a real estate tech and data company, today announced the City of Miami Beach and Bal Harbour Village are the latest Florida cities to adopt the Gridics 3D zoning map, text and property data platform to bring simplicity, transparency, and efficiency to what can otherwise be a very complicated process for city planners and residents trying to understand zoning code changes and potential.

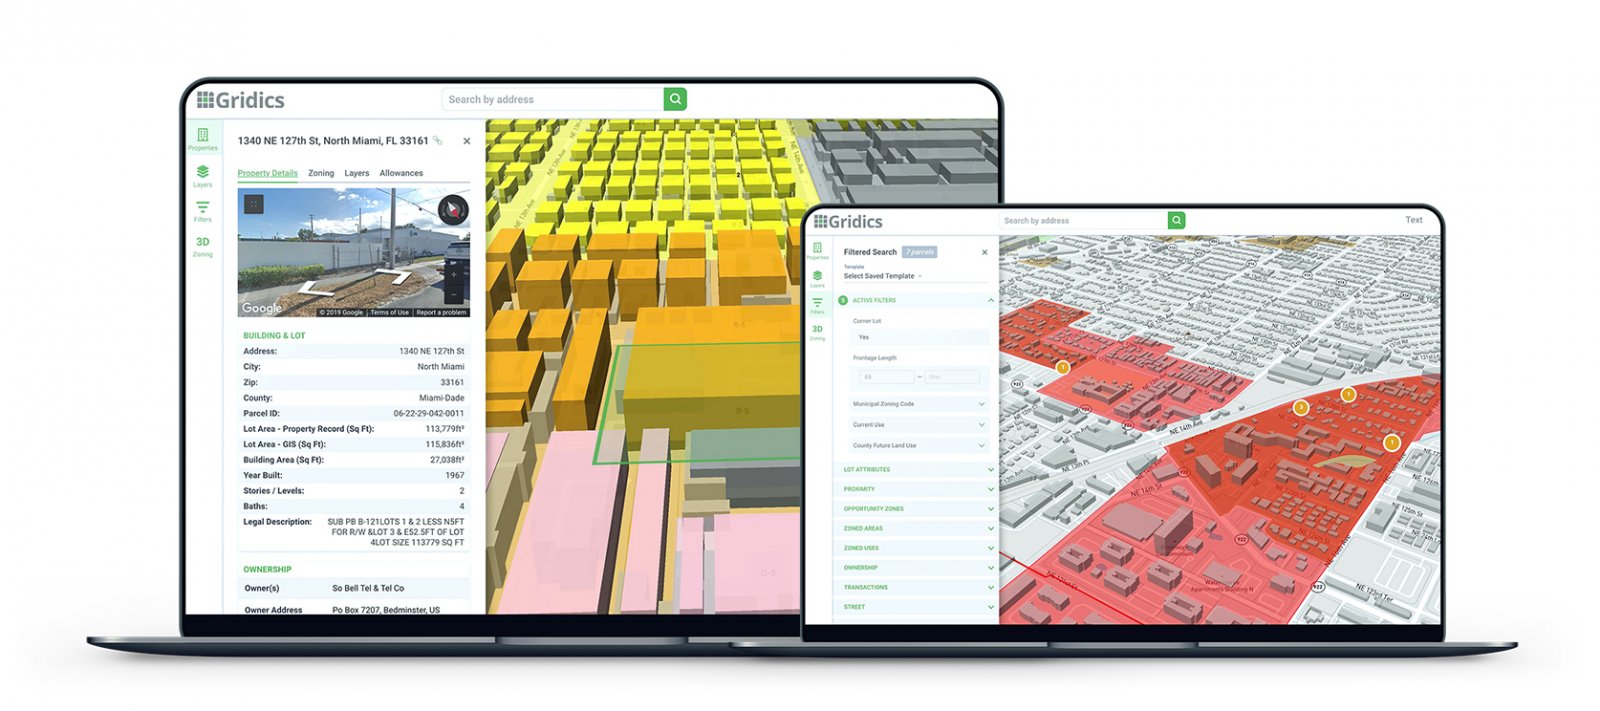
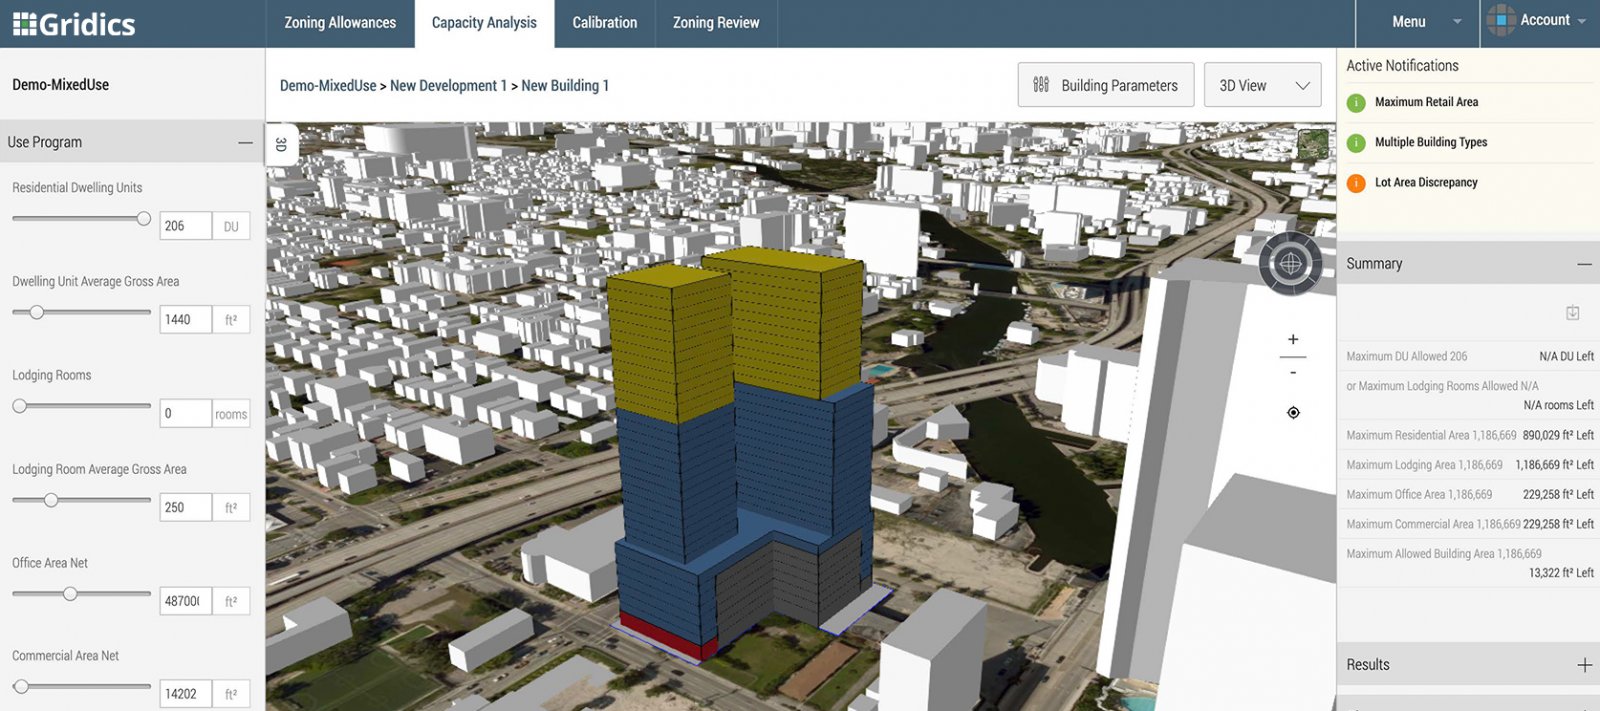
Gridics helps municipalities in three ways.  First, a unified 3D interactive map and zoning code website allows municipal staff and citizens to visualize the buildable capacity of every parcel as allowed by zoning and publish code text changes in real-time.  Second, online property lookup tools deliver deep, parcel-specific zoning data to help citizens get answers to common zoning questions which significantly reduces phone calls and in-person visits to the planning staff.  Third, municipal staff members can easily run 3D scenario analysis of current zoning allowances, visualize proposed zoning changes and more quickly check permit applications and development plans for compliance.

For low-lying coastal communities like Miami Beach and Bal Harbour grappling with sea level rise and the broader impact of climate change on their built environment, zoning changes are a key piece of the solution puzzle.

“Gridics has developed cutting edge technology that facilitates analysis of a city’s zoning ordinance and allows for the visualization of changes in a built environment.  The technology provides transparency to the public as the community and elected officials consider the benefits and impacts of proposed projects.  Additionally, having zoning text and zoning map integrated allows the city to update its zoning ordinance quickly and efficiently.”  Said Carmen Sanchez, Deputy Planning Director Miami Beach.

The Gridics platform aims to make it easier for citizens, investors and developers to do business and interact with municipalities by bridging the communication gap that the existing municipal zoning text publishing and mapping tools perpetuate.  This ranges from large initiatives such as helping citizens and elected officials to visualize proposed zoning changes to more everyday processes like reducing the time staff spends servicing basic zoning questions both in person and via phone.

“We’re thrilled to add Miami Beach and Bal Harbour to the Gridics municipal network” said Jason Doyle CEO of Gridics.  “Our team of urban planners and software engineers are passionate about helping to build better cities and that starts with progressive and innovative municipal partners focused on leveraging the latest technology and tools to make them easier to work with.”

Other Florida jurisdictions that have adopted Gridics include Miami, Fort Lauderdale and North Miami to name a few.

About Gridics:  Gridics develops real estate data and software applications in the area of real estate development analysis and interpretation.  For more information, visit www.gridics.com.

Gridics Expands Market Coverage to Los Angeles, Dallas, Austin, Denver and More

3D development feasibility software and API available in more major cities; opportunity search to follow

For Immediate Release:  June 25, 2019

Miami, FL – Gridics LLC, a Miami-based real estate tech and data company, today announced the expansion of its real estate development analysis platform to include six more major cities.  The Gridics platform allows users to calculate and visualize, in 3D, the development feasibility and capacity of a parcel or assemblage of parcels, inclusive of complex considerations like zoning overlays, use specific allowances and parking requirements.

The Gridics platform is used by real estate developers, investors, brokers and municipalities.  Launched two years ago, Gridics started with Miami before adding New York City and a number of other cities that contract to use the platform in their zoning and planning departments.  With this announcement, Gridics platform users can now analyze parcel-specific zoned development opportunity in Los Angeles, Denver, Dallas, Austin, Orlando and Kansas City.

“Parcel-specific zoning data and attributes are used in numerous areas of the multi-trillion-dollar real estate vertical and is a major driver of development decision making as well as valuation,” says Jason Doyle, CEO of Gridics.  “Yet given the broad written structure of municipal zoning regulations, determining how zoning regulations apply to specific parcel shapes has always been a manual process, resulting in laborious research costs and permit approval delays.  Our technology delivers this important data in real-time.”

In the coming months, Gridics plans to add Chicago, Detroit, Tampa, Jacksonville, San Antonio, El Paso and Washington DC.  In addition to individual application use, enterprise users can utilize the Gridics API to pull real-time property zoning data such as applicable zones and overlays, maximum buildable area, maximum footprint, allowable addition, height, density, setbacks and more.

“After years of development, our engine and data has been pressure tested by many different city zoning departments,” says Doyle.  “We are now aggressively scaling our coverage into all the major markets and in doing so are amassing an ocean of proprietary real estate data that we will leverage to drive smarter development and investment decisions while creating greater efficiencies across the real estate spectrum.”

As Gridics expands the coverage of its calculated development data footprint, it is working with leading commercial brokerage firms and developers to deliver a first-of-its-kind development opportunity and site-selection search.  Users of this new app will be able to search for properties based on the Gridics development potential data and gain unique insights into untapped property values.  It is expecting an alpha launch later this summer.  To gain early access, send an email to info@gridics.com.

About Gridics:  Gridics develops data and software applications in the area of real estate development analysis and interpretation.  For more information, visit www.gridics.com.

Discover 3D Zoning & Planning in Our Next Webinar – Tues, June 13th

In May 2017, the City of Miami became the world’s first municipality to have a site-specific, digitized zoning code thanks to our Gridics 3D zoning management platform.  Miami is now able to visualize zoning codes in 3D, perform real-time scenario analyses, and reduce the plan review backlog — processes that drastically improve the efficiency and transparency of government operations.

We’re quickly expanding to other major US municiplaties and want to explain how Gridics can drive efficiency in your city governments and private organizations as well (architects, developers, urban planners, etc).

Join us on Tuesday, June 13th at 10am OR 1pm for a free 30 min. webinar:  http://webinars.zonar.city/

We’ll be giving you a behind the scenes look at the Gridics platform and covering valuable topics including how to:

  • Conduct faster & more accurate development plan reviews
  • Visualize 3D zoning capacity in real time
  • Test new zoning scenarios to improve development patterns
  • Improve transparency with the public

See you on Tuesday!

Gridics Releases Q1’17 Miami Neighborhood Trends Report

Every day, there’s a new article predicting the rise and fall of Miami’s notoriously complex real estate market.

To make sense of the speculation, we went back to the data.

Not just any old back of the napkin calculations…  The cold, hard, street-level data.  In other words, we wanted to know exactly what’s happening in our own Miami backyard.

Through the Gridics hyper-local real estate platform, we compiled data across key Miami neighborhoods and cross-referenced those trends with news articles, demographic information, and top agent insight.

Our findings can be found in our first-ever Q1’17 Miami Neighborhood Trends Report.

This report is crucial to the future of your business, and here’s why…

1) Know the Neighborhoods — Every Miami neighborhood is defined by its own set of characteristics.  The prices fluctuate differently, the demographics are varied, and most importantly, the way of life and local hotspots are completely unique.

As a real estate professional, you’re expected to be in fifty places at one time.  We know this is an impossible expectation, so that’s why we compiled neighborhood summaries for you in one report.  Consider it a one-stop-shop for the quarterly real estate pulse in major Miami markets.

2) Stay Two Steps Ahead — The best real estate professionals are the ones who understand where the market has been, what the landscape currently looks like, and how conditions will shift in the future.

The power of Gridics.com, combined with our Q1’17 Market report, provides real estate professionals like you with the insights necessary to stay ahead of your clients and competition.

3) Demonstrate Your Expertise — An organized, intelligent report is one thing.  But we’re taking it one step further…

Now, you can brand/customize your own Q1’17 Market Trends report to send to clients.  Imagine generating an industry-leading real estate report with your picture, logo, and contact information and delivering it to clients with just a few clicks.

There’s no better way to demonstrate your credibility.  Provide value in the form of helpful real estate insights.  Be the expert your clients will rely on again and again.


Miami CBD Re-Sale Condo Prices Flat Vs. Year Ago, Amidst Declining Sales Volume

The aggregate median price per square foot of condominiums built after 2004 (resale data only) was $387 in March of 2016, exactly as it was in March of 2015 for the area including: Brickell, Downtown, Omni, Edgewater & Midtown (See Map Below). While the re-sale market seems to be holding in price, we are however seeing a decrease in quantity of sales. March of 2015 had a total of 115 condo sales while March of 2016 had 89 sales; A 23% drop in quantity of closings. See the chart at Gridics.com.

At a macro level it seems that the condo market in Miami CBD areas peaked in July of 2015 with a median price per square foot of $485 (Full Chart Here). This number surpasses the previous high point of $470 per square foot in December of 2006 (Although adjusted for inflation/CPI the pricing in 2006 was higher than today’s with $470 in 2006 being equal to $554 today). Looking at these macro trends in the booming (and now not-so-booming) areas of Miami show that the alleged “downturn” in the real estate market is not yet quite as severe as many will have you think. 

Are High-Design Playrooms the New Frontier of the Amenity Arms Race?

Some of Miami’s biggest new condo towers are being planned with well-heeled, worldly families in mind, with larger units, more amenities for the kids, and ‘service suits’ to stash the live-in nanny. A few incorporate a theme park’s worth of diversions (think of the soccer field, boxing ring, and jam studio at Paramount Miami Worldcenter or the mini water park, indoor/outdoor playrooms, kid’s gymnasium, and rooftop theater of 1010 Brickell, both under construction) while developers of other buildings are focusing on really tricked-out and designed-up playrooms.

Continue reading “Are High-Design Playrooms the New Frontier of the Amenity Arms Race?”

The Suburbs Are Falling Behind the Urban Core, and Might Not Catch Up

The 2008-2011 market crash that left construction cranes dangling above Miami’s unfinished towers and unbuilt outer-suburban communities more-or-less came to a halt in 2010, marking the beginning of a recovery. Unlike that earlier condo boom when increased developments and prices in the outer banlieues mirrored the inner urban core (places like Downtown, Brickell, Edgewater, Coconut Grove, and South Beach) much more closely, suggesting that buyers previously wanted to live out there as much as in here, the core quickly took off and the suburbs did not.

Continue reading “The Suburbs Are Falling Behind the Urban Core, and Might Not Catch Up”

Lower Miami River Exploding; Over $7 Billion in Recorded Sales Since 2000

The formerly-neglected Miami River has seen incredible action in the last two real estate cycles, with literally billions of dollars trading hands and thousands of new units coming to market in buildings like One Miami, Flagler on the River, and Icon Brickell. Since the year 2000, the lower river (the section between Spring Garden and Biscayne Bay), including properties up to a single block inland, has seen $7.3 billion in recorded sales, with almost all of it ($7.08 billion to be exact) concentrated in the blocks between Biscayne Bay and I-95. In 2010, the most lucrative year in the river’s history, $1.089 billion in sales were made.

Continue reading “Lower Miami River Exploding; Over $7 Billion in Recorded Sales Since 2000”

Millennials, Malls, and a Bit of Miami the Focus at UM Real Estate Impact Conference

The University of Miami’s annual Real Estate Impact Conference, was held earlier this month at Brickell’s Four Seasons Tower, and topics revolved around trends in the commercial and retail and market, the rise of the Millennial generation, and technology’s real estate dominance in this cycle and the future, both through new construction and estate data and analysis.The University of Miami’s annual Real Estate Impact Conference, was held last month at Brickell’s Four Seasons Tower, where topics revolved around trends in the commercial and retail and markets, the rise of the Millennial generation and their impact on real estate, and technology’s increasing dominance in this cycle and the future. READ ON FOR A FULL VIDEO REPLAY >>

Continue reading “Millennials, Malls, and a Bit of Miami the Focus at UM Real Estate Impact Conference”

877% Increase in Liquor & Tobacco Licenses Shows New Era for Wynwood & Midtown

Liquor and tobacco licenses have exploded in Wynwood, Miami’s most famous arts district, and Midtown Miami, its more yuppie-ish conjoined twin, over the last six years by a whopping 877%. This is a significantly higher increase over the 174% average across Miami, and a major indicator of the direction the two neighborhoods are growing, according to data compiled by Gridics. Between I-95, NE/NW 20th, Biscayne Boulevard, and I-195, 66 alcohol and tobacco licenses were granted since January 1st 2010 for restaurants, bars, and other establishments like Sugarcane on Midtown Boulevard, and Gramps on NW 24th Street. Wynwood even has a microbrewery scene. Three out of those 66 licenses are tobacco permits. Expired permits are not included.

Continue reading “877% Increase in Liquor & Tobacco Licenses Shows New Era for Wynwood & Midtown”