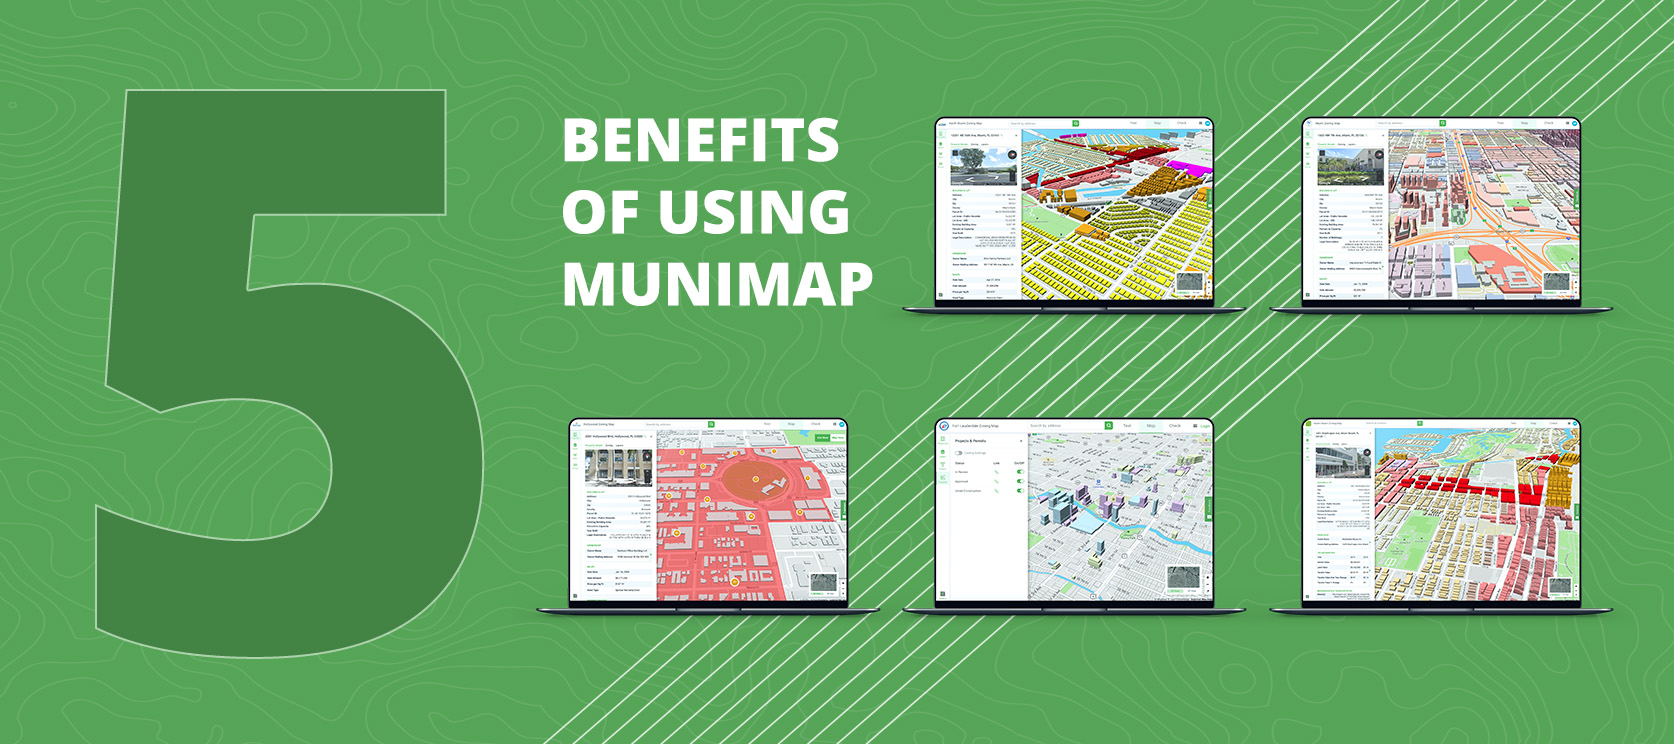
MuniMap Takes the Hassle Out of Zoning Visualization for Staff & Citizens
Register for Upcoming Webinar: webinars.gridics.com
It’s no secret that municipal zoning can be difficult to understand and navigate. Antiquated code text documents lead to hundreds—if not thousands— of citizen inquiries each year, cause headaches for staff to update, and ultimately impede new development.
MuniMap by Gridics was designed with one simple question in mind…. What if we made it easy to visualize zoning and real estate data at the parcel-specific level?
MuniMap brings zoning and real estate data to life like never before.
How can you expect staff, citizens, stakeholders, developers, and council members to imagine the impact zoning rules in a static text document will have on the skyline of a city? The bottom line is…. You can’t. That’s exactly why we built MuniMap — to make zoning and real estate data interactive, accessible, and transparent for everyone, all the time.
Municipalities across the country are leveraging MuniMap in unique ways, and here are just a few examples:
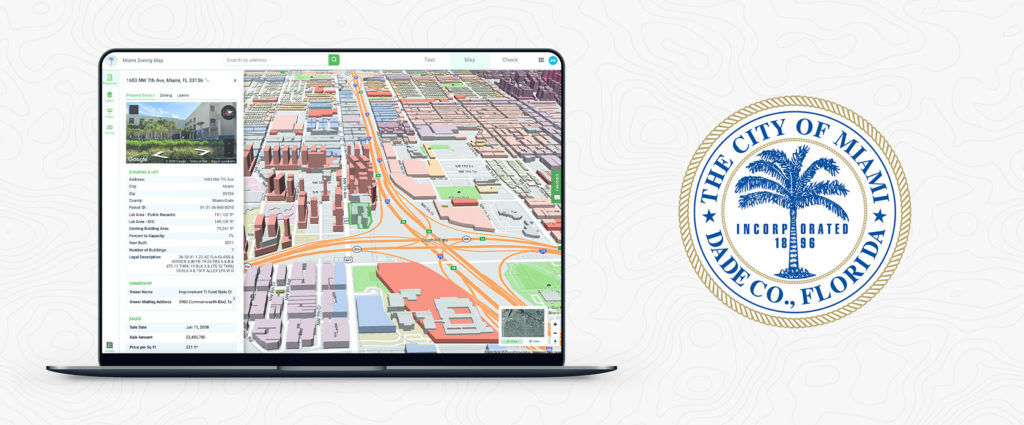
1) Visualizing by-right zoned development potential in 3D – City of Miami, FL
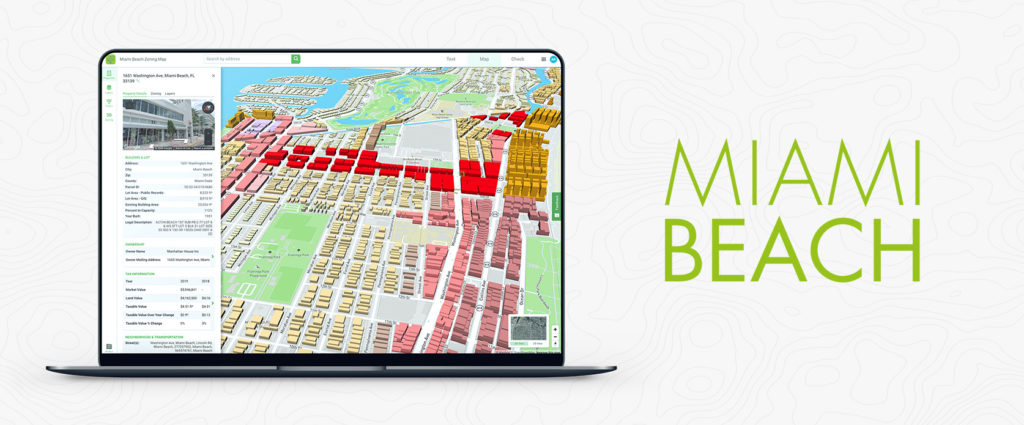
2) Leveraging the deepest parcel-level zoning data available to help reduce emails, phone calls, and front counter traffic – City of Miami Beach, FL
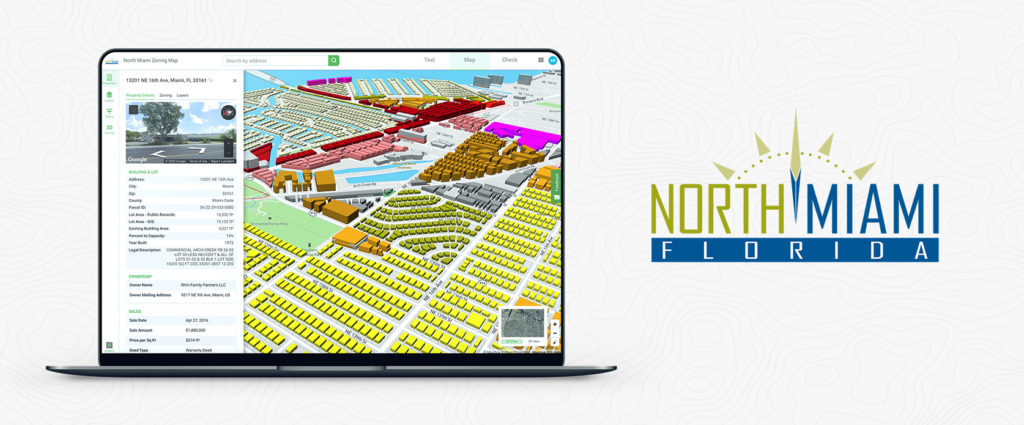
3) Encouraging and attracting new development – City of North Miami, FL
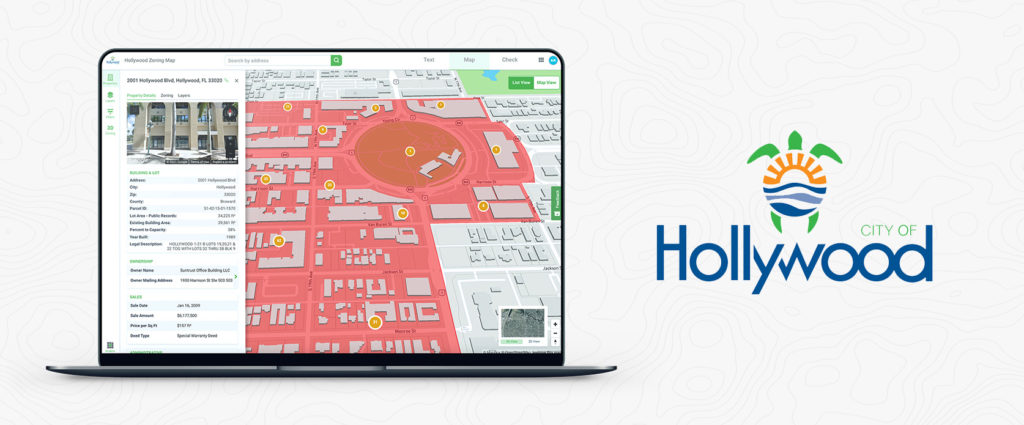
4) Giving citizens the ability to interact with zoning, GIS layers, and robust property filters – City of Hollywood, FL
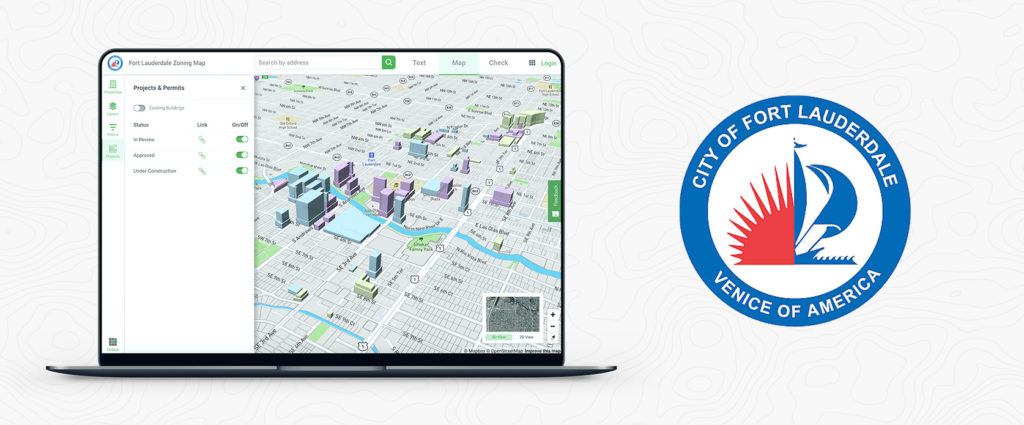
5) Showing the real-time status of current development projects – City of Fort Lauderdale, FL
MuniMap delivers transparency for citizens, saves municipalities thousands of dollars each year on zoning management expenses, reduces low-value staff time, and improves collaboration with stakeholders and council members.
Join an upcoming webinar or contact our team today to learn how your municipality can be live on MuniMap in <6 weeks.

